Cobweb Plots
Suppose we have a one-dimensional Picard sequence which starts at , and then is defined by
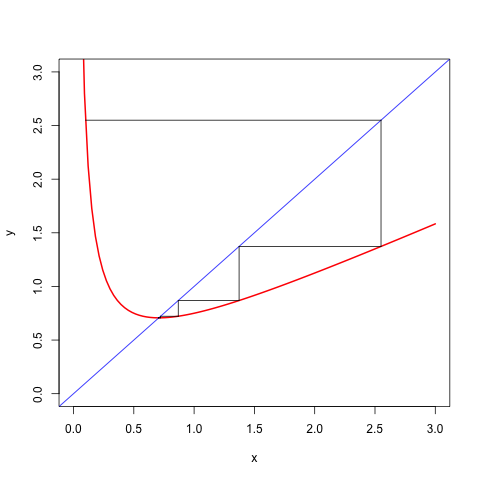
The cobweb plot draws the line and the function . A fixed point is a point where the line and the function intersect. We visualize the iteration by starting at , then draw a horizontal line to , then draw a vertical line to , and so on. For a convergent sequence we will see zig-zagging parallel to the axes in smaller and smaller steps to a point where the function and the line intersect.
An illustration will make this clear. The Newton iteration for the square root of is
The iterations for starting with are in the cobweb plot in figure 1.
We also give R code for a general cobweb plotter with a variable number
of parameters.

Figure 1: Cobweb plot for Newton Square Root Iteration </center>